Screenshots
Case study
A research dashboard that made a database of independent journalists and creators easier to browse and assess.
The program team had a long list of independent journalists and creators with just their names and outlets. That wasn't enough to judge who belonged in the database, so they asked whether I could fill in the gaps.
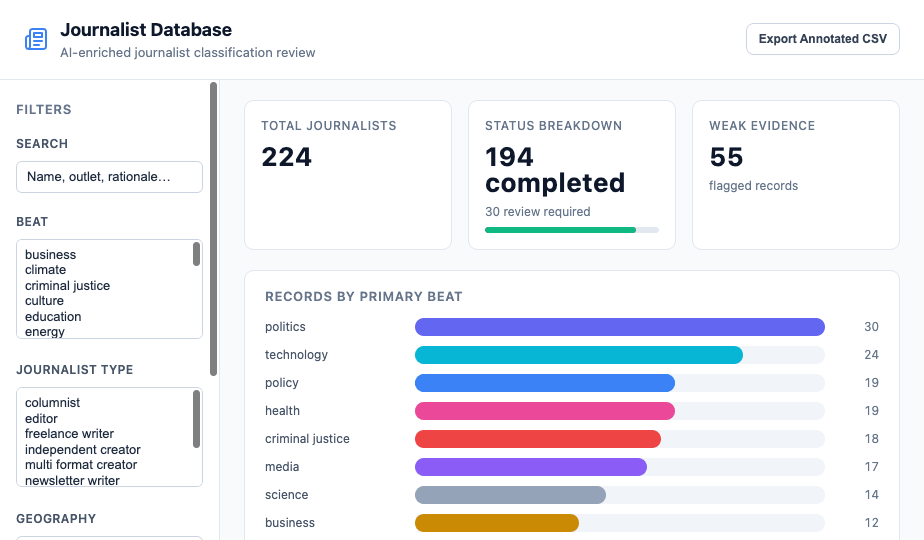
I built a pipeline and a dashboard that opens as a single file in any browser. For each name, the pipeline runs a few targeted web searches, pulls out evidence, and tags the person by beat, type of creator, and location, with a confidence level. The sources and reasoning stay attached to each record so reviewers can see why it was tagged the way it was.
The dashboard holds all 1,165 records. A summary strip shows counts by beat and review status. Reviewers can filter and sort the table and open any record to read the evidence behind its classification. If they disagree they can correct the classification and leave a note. Records worth a second look get a star, and the annotated set exports back to CSV.
The risk was a tidy-looking label with nothing behind it. So every classification shows the snippet and one-line reasoning it came from, and a low-confidence match goes to a person for review instead of into the export.